Ninigret Pond Soil Pedon Description: VBI (Mainland Submerged Beach (sand phase))
Quick Links:
Site Information
Pedon Description
Map Unit Description
Lab
Data
Chemistry Data
Soil Profile Image
|
Print Date: |
06/14/2004 |
||||||||||||||||||||||||||||||||||||||||||||||||||||
|
Description Date: |
09/18/2000 |
||||||||||||||||||||||||||||||||||||||||||||||||||||
|
Describer: |
Mike Bradley |
||||||||||||||||||||||||||||||||||||||||||||||||||||
|
|
|||||||||||||||||||||||||||||||||||||||||||||||||||||
|
Site ID: |
VBI |
||||||||||||||||||||||||||||||||||||||||||||||||||||
|
Site Notes: |
Vibra Core Description |
||||||||||||||||||||||||||||||||||||||||||||||||||||
|
Pedon ID: |
VBI |
||||||||||||||||||||||||||||||||||||||||||||||||||||
|
Pedon Notes: |
|
||||||||||||||||||||||||||||||||||||||||||||||||||||
|
Lab Source ID: |
URI |
||||||||||||||||||||||||||||||||||||||||||||||||||||
|
Lab Pedon #: |
|
||||||||||||||||||||||||||||||||||||||||||||||||||||
|
|
|||||||||||||||||||||||||||||||||||||||||||||||||||||
|
|||||||||||||||||||||||||||||||||||||||||||||||||||||
|
|
|||||||||||||||||||||||||||||||||||||||||||||||||||||
|
Pedon Type: |
|
||||||||||||||||||||||||||||||||||||||||||||||||||||
|
Pedon Purpose: |
Research – Masters Thesis |
||||||||||||||||||||||||||||||||||||||||||||||||||||
|
Taxon Kind: |
|
||||||||||||||||||||||||||||||||||||||||||||||||||||
|
Associated Soils: |
|
||||||||||||||||||||||||||||||||||||||||||||||||||||
|
|
|||||||||||||||||||||||||||||||||||||||||||||||||||||
|
Location Information |
|||||||||||||||||||||||||||||||||||||||||||||||||||||
|
Country: |
USA |
||||||||||||||||||||||||||||||||||||||||||||||||||||
|
State: |
RI |
||||||||||||||||||||||||||||||||||||||||||||||||||||
|
County: |
Washington |
||||||||||||||||||||||||||||||||||||||||||||||||||||
|
MLRA: |
149B |
||||||||||||||||||||||||||||||||||||||||||||||||||||
|
Soil Survey Area: |
|
||||||||||||||||||||||||||||||||||||||||||||||||||||
|
Quad Name: |
Quonochataug |
||||||||||||||||||||||||||||||||||||||||||||||||||||
|
|
|||||||||||||||||||||||||||||||||||||||||||||||||||||
|
Location Description: |
Ninigret Pond, Charlestown, RI Shallow water area north of island with duck blind west of private dock |
||||||||||||||||||||||||||||||||||||||||||||||||||||
|
Legal Description: |
|
||||||||||||||||||||||||||||||||||||||||||||||||||||
|
|
|||||||||||||||||||||||||||||||||||||||||||||||||||||
|
Latitude: |
41 22 7.93256 N |
||||||||||||||||||||||||||||||||||||||||||||||||||||
|
Longitude: |
071 38 35.85220 W |
||||||||||||||||||||||||||||||||||||||||||||||||||||
|
Datum: |
NAD83 |
||||||||||||||||||||||||||||||||||||||||||||||||||||
|
UTM Zone: |
19 |
||||||||||||||||||||||||||||||||||||||||||||||||||||
|
UTM Easting: |
278929 meters |
||||||||||||||||||||||||||||||||||||||||||||||||||||
|
UTM Northing: |
4583078 meters |
||||||||||||||||||||||||||||||||||||||||||||||||||||
|
|
|||||||||||||||||||||||||||||||||||||||||||||||||||||
|
|||||||||||||||||||||||||||||||||||||||||||||||||||||
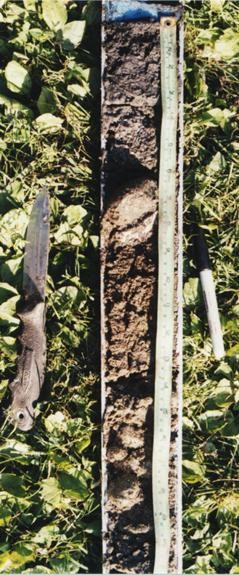
A--0 to 10 centimeters; very dark gray (5Y 3/1), sandy loam; 1 percent shell fragments; abrupt boundary.
C1--10 to 15 centimeters; coarse sand; 5 percent shell fragments; abrupt boundary.
2C1--15 to 26 centimeters; dark gray (5Y 4/1), loamy sand; 30 percent mixed rock fragments; abrupt boundary.
2C2--26 to 36 centimeters; olive gray (5Y 4/2), loamy sand; abrupt boundary boundary.
2C3--36 to 56 centimeters; olive gray (5Y 4/2), coarse sand; 60 percent mixed rock fragments.
Map Unit Description (Bradley Stolt)
GMs(B) – Mainland Submerged Beach (sand phase), 2 – 4% slopes: These soils are found in shallow (1.1 m or less) sand flats abutting the mainland shoreline or the GMb unit. The subaqueous soils of this unit are characterized by a 5 – 15 cm surface horizon of very dark gray, and olive gray, fine and very fine sand of Holocene age. Subsurface horizons are glacial fluvial material comprised of olive gray and dark grayish brown loamy coarse sand, and coarse sand, with 10 – 70% gravel and cobbles. Most soils classify as Typic Endoaquents. Submerged topography is moderately sloping and eelgrass cover is low (10%).
Field Description:
|
Horizon |
Depth (cm) |
Boundary |
Field |
n-value |
Munsell |
Munsell |
Redox features |
Field |
Shell |
Notes |
|
|
lower |
Dist. |
Texture |
|
Color |
Color |
Color/Conc. |
Coarse |
Frags % |
|
|
|
boundary |
|
Class |
|
(matrix) |
Name |
|
Frags % |
|
|
|
A |
10 |
a |
sl |
|
5Y 3/1 |
very dark gray |
|
|
1% |
|
|
C1 |
15 |
a |
cos |
|
5Y 4/1 |
dark gray |
|
|
5% |
|
|
2C1 |
26 |
a |
grls |
|
5Y 4/2 |
olive gray |
|
30% |
|
|
|
2C2 |
36 |
a |
ls |
|
5Y 4/2 |
olive gray |
|
|
|
|
|
2C3 |
56 |
|
vgrcos |
|
5Y 4/2 |
olive gray |
|
60% |
|
|
|
Horizon |
Depth (cm) |
% Coarse Frags |
% Shell Frags |
% VCO (1-2 mm) |
% CO (1-0.5 mm) |
% M (0.5-0.25 mm) |
% F (0.25-0.1 mm) |
% VF (0.1-0.05 mm) |
% Total Sand |
% Silt |
% Clay |
USDA Texture Class |
|
A1 |
10 |
1 |
0.19 |
5.2 |
13.6 |
13 |
0.5 |
58 |
90.3 |
8.6 |
1.1 |
vfs |
|
C1 |
15 |
30.77 |
1.85 |
25.8 |
19.6 |
11.2 |
12.4 |
26.1 |
95.1 |
3.9 |
1 |
grcos |
|
2C1 |
26 |
57.18 |
0 |
22.8 |
20.7 |
10.3 |
14.2 |
14 |
82 |
17 |
1 |
vgrlcos |
|
2C2 |
36 |
7.91 |
0 |
20.6 |
32.7 |
16.2 |
6.2 |
7 |
82.7 |
15.2 |
2.1 |
lcos |
|
2C3 |
56 |
71.43 |
0 |
24.3 |
32.2 |
18.5 |
0.1 |
14.9 |
90 |
9 |
1 |
egrlcos |
|
Horizon |
Depth (cm) |
Total Nitrogen (%) |
AVS (ug/g) |
CRS (ug/g) |
CaCO3 (%) |
Organic Carbon (%) |
|
A1 |
10 |
0.0000 |
9.0 |
266.0 |
0.3440 |
0.6344 |
|
C1 |
15 |
0.0343 |
0.0 |
5.4 |
0.3485 |
0.3776 |
|
2C1 |
26 |
0.0000 |
0.0 |
31.7 |
0.2457 |
0.5562 |
|
2C2 |
36 |
0.0699 |
0.0 |
7.3 |
0.5029 |
0.8395 |
|
|
|