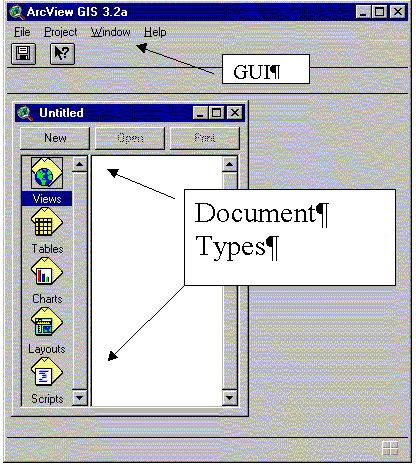
The main Arc View project window.
Basic Arc View Topics:
This Document is written by Jim Turenne, it is intended to provide basic information on using Arc view GIS and the MassGIS Data Viewer. Topics will be updated/added as an ongoing effort. Contact Jim Turenne for more information or to report errors. Additional information on GIS can be found at: www.gis.com.
Basic GIS - Data Models, Vector, Raster, Images.
Shape files vs Coverages – The difference between the two formats, how to convert from a coverage to a shapefile, where to get them. Shape file structure – The files included with a shape file (*.sbn, *.shp, *.dbf).
Arc View Project Files (APR files), GUIs, Document Windows/Types.
Theme Properties and Table Properties
Attribute Table Structure: Editing Tables, Adding Fields, Calculating Acres.
Adding an event theme – taking a text file with coordinates (GPS, etc) and making it into a shape-point file.
Projection utility – How to convert UTM to Mass State Plane.
Modifying an APR file – if you get an apr file that keeps asking you "where
is ortho.dbf". Changing the paths with a text editor.
Projections/Datums – NAD 83 vs NAD 27 datums, geographic vs projected
coordinates.
Customizing the GUI – How to add/remove buttons from the GUI.
Scripts – How to load and run them.
Extensions – Available extensions, how to load them, get them, use them, and
activate them.
Importing E00 files – How to take and Arc Info file (E00 extension) and view it
using the import utility.
Geoprocessing wizard – How to use the extension, some of the uses.
The MassGIS data viewer.
ArcView legend files, editing legends.
Layout document window – creating maps for printing.
Data Models: Vector and Raster.
Vector – geographic features – points, lines, and polygons.
Raster – continuous geographic phenomenon such as elevation, images, grid data.
Image data is in raster form, many types of image data – BMP, BIL, IMG, JPG, SID, TIF. In order to view image data in real world coordinates you need the world file to register the image (first and last letters of the image extension followed with a "w" such as BPW or TFW for Bitmap and Tif files.
Coverages – spatial data structure used in ARC/INFO, attribute data is stored in the INFO directory.
Shapefiles – a data structure developed by ESRI for ArcView (desk top) GIS. Shapefiles are easier and faster to draw and can be edited (coverages cannot). Shapefiles are composed of at least three files: *.shp (stores the feature geometry), *.shx (stores the index coordinates to the geometry), and *.dbf (dBASE file that stores the attribute information of features). Additionally, you may see several other files with the same file name such as *.sbn and *.sbx (spatial indexes), *.prj (stores the projection and datum of the shapefile – very good to have if exchanging the data or using with a GPS such as ArcPAD).
ArcView Project Files - *.apr contains a collection of AV documents (views, scripts, layouts, etc.). The APR file does NOT contain the data (Shapefiles), it is simply a text file that contains the settings, paths, etc. Each document type has different graphical user interfaces (GUI). You can edit APR files with any text editor such as MS word or word pad to change paths.

The main Arc View project window.
View Document Window – used to display and query spatial data and typically contains multiple THEMES (shapefiles, coverages, images) that are in the same geographic projection.
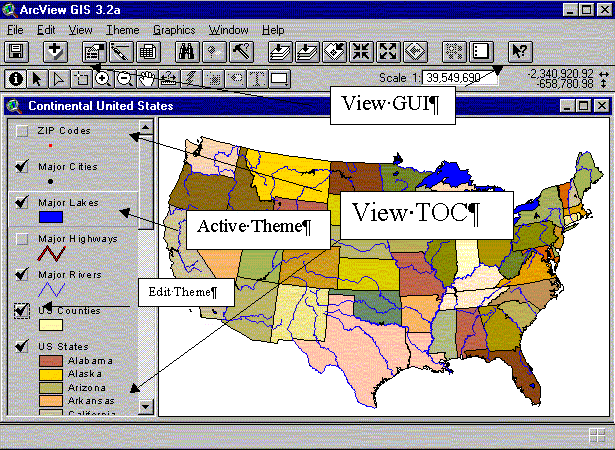
Arc View's VIEW document window.
Theme Properties Window – A set of geographic features of similar type (point, poly, line).
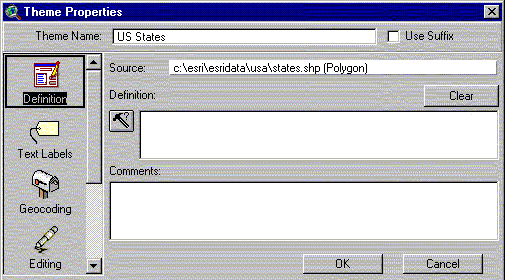
Theme properties window, to open make the theme active and click the
Theme-Properties in the menu.
Table Document Window – Attribute data is displayed, queried, and edited through the table document. The data is stored in the shapefiles dBASE table (*.dbf file). A table file contains a number of records, one for each feature, and a series of fields, one for each attribute.
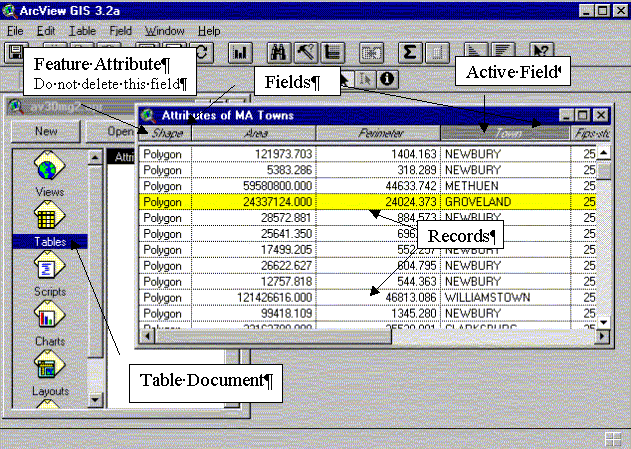
Table Document Window, this table is the attribute table for the MA Towns theme.
Attribute data formats – dBASE (*.dbf – use dBASE IV), text (*.txt – use tab or comma delimited), relational database (INFO, ORACLE, SQL). Most of these formats can be exported and edited with excel (use excel 2000) or access. Always make backups when editing these files!
Table Limits and Structure – Maximum of 4 billion records. Null values are usually represented by zeros. A dBASE (IV) file can contain a maximum of 255 fields. Field names are limited to 10 characters, must start with a letter, and contain only these characters: A-Z, numbers, and _. A string field (words) can contain a maximum of 254 characters. A number field has a maximum of size of 16 characters. Boolean fields are used for queering and contain true/false (yes/no) characters.
Date Fields – AV 3.2 supports date ranges from 4715BC to 9999 AD. The date field format used for AV is the following: yyyymmdd so for today, December 9, 2002 the field would be – 20021209.
Editing Tables and Adding Fields – To edit a table open the table document, select the table menu and click the start editing selection. The Edit button has choices to add fields, delete fields, delete records, etc. When finished remember to select "Table – Stop Editing" and save edits. A common field to add to a polygon theme is one for the acreage of each polygon record, here is the procedure to add an Acre field, and use the Field Calculator to calculate the acres:
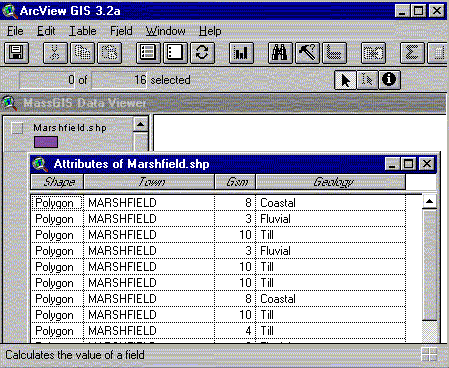
Here is the original attribute table for the Marshfield General Soil Map. Notice there are only four fields; shape, town, gsm, geology.
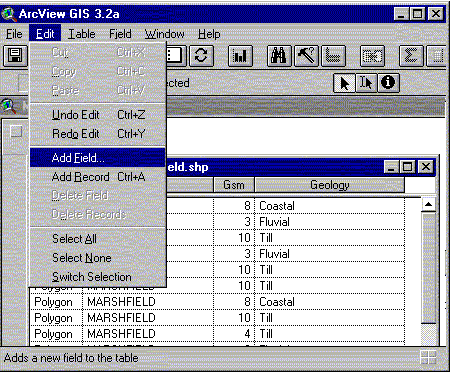
Click the "Table" menu, then click "Start Editing". Next, click the "Edit" menu and select "Add Field".
Add two fields, one called Area (this will be used to calculate the area of each polygon in square meters), the other called Acres (for this field you will convert the Area field to acres using the conversion factor of 0.0002471 acres/sq. meters).

The new table should look like this, note two new fields are added (Area, Acres):

Now use the Field Calculator populate the values
![]()
First calculate the area of each polygon using the following formula (make the area field active): [Shape].ReturnArea (Note: the field calculator needs values typed in precisely - caps, spaces, etc.)

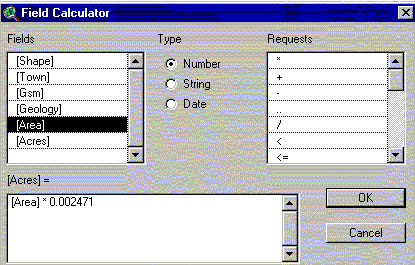
Next calculate the acres of each polygon (make the acres field active) using the following formula: [Area] *0.0002471
The table will now have the acres for each polygon:

Finally choose: Table-Stop Editing and save edits.
Adding an Event Theme – Taking GPS Coordinates and Plotting Them as a Point Shapefile:
Be aware that there are scripts and extensions (GPStoSHP.ave) available to do this automatically for Garmin and PLGR GPS's. Here is how if you do not have them or want to create an event theme:
Get your data into a tab/comma delimited text file. Use Excel to create the file, add a header record for the coordinates Easting and Northing:
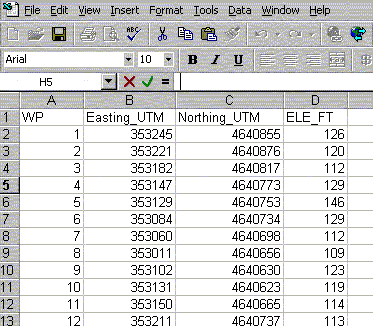
A screenshot of a tab delimited file, note is good practice to specify units
for geo-tables (these coordinates are in UTM, elevation is in Feet).
|
|
|
|
Figure 1 (Step 3 above) – Adding the text file to the Tables Document Window. |
Figure 2 (Step 4 above) – Adding an Event Theme from the View Document Window. |
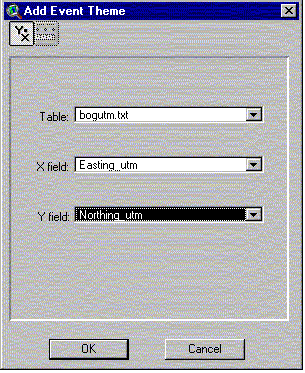
Figure 3 (Step 4 above) – The Event Theme dialog box, select the
fields with the X and Y coordinates.
ArcView Projection Utility – Use this extension to reproject projections and convert datums (NAD 27 to NAD 83) and projections (UTM to State Plane). The projection utility extension must be loaded (File-Extensions-click the box for the projection utility). The utility takes a very long time to load and reproject data!


MORE TO COME