How to use GPS data to create contour maps using SURFER and ArcView GIS
By Jim Turenne, email questions.
Related Article: Using GPR, GPS and GIS to Inventory Peat Resources in Cranberry Beds
NOTE: If you need help with basic ArcView tasks click HERE for more info on using ArcView GIS
The following are general instructions on how to produce
contour maps from GPR data or other remote sensing
equipment using Global Positioning Systems (GPS), Arc/View GIS, and SURFER software. Text in
quotations refers to (menu) commands for the software program to
select.
The first thing to consider is what base map you will be projecting the contour plot onto and what are the proper projections and datum's to set on the GPS. In Massachusetts, GIS data available from Mass/GIS is in Massachusetts State Plane NAD 83 coordinates. Most GPS units do not record waypoint locations in State Plane coordinates so the data will have to be converted using Arc/View's projection utility (click link to learn how to do this). The datum for the GPS unit should (almost always) be set for NAD 83 (WGS84 is also OK). I prefer to have the GPS set to record in UTM projection rather than geographic (Lat/Lon) coordinates to make re-projection easier and to keep units (meters or feet) the same.
GPS Survey:
Conducting the survey with the GPS should be performed
like any survey with detailed notes of waypoints recorded so the
data can be checked for accuracy after it is downloaded. The GPS will provide
the X,Y coordinates for the contour map. The Z value will represent the variable
your are collecting the data for such as elevation, depth to an interface, EM
reading, etc. You will need to
modify the GPS data to include this Z value unless your equipment can
automatically enter the value. This can be done after the survey. Although
low-cost GPS units provide altitude (elevation) data, the quality of the data is
not accurate for most purposes. Try to run traverses in an equally spaced grid
pattern and collect as many observations as possible to increase the accuracy of
the data/map.
File Naming Conventions:
Creating contour maps typically generates a lot of different files. It is useful to develop a file naming convention for your data and create a folder directory for the various file types and associated programs (mydata/surfer files/ etc.). If you have ArcGIS I strongly recommend creating metadata for each coverage you create, Arc Catalog has a template for creating metadata. I also like to include information such as the projection (shapefile_UTM.shp or shapefile_SP.shp for UTM or State Plane data). The attribute table (shapefile.dbf or the text file with the GPS data) should also include the units in the field header particularly if you will be using both feet and meters (Easting_M, Depth_FT for example). If you will be calculating volumes (cuts vs. fills) you must keep the XYZ data in the same units.
Download Waypoints:
There are several ways to download the GPS Data to your computer. Your goal is to download the GPS waypoint data into a text file or any ASCII file so it can be imported into Arc/View. There are many programs available that will download GPS waypoint data directly into a GIS program (create a point or line shape file). If you are using a PLGR GPS there is an ArcView script available from the Nebraska NRCS web site (plgr2shp.avx). If you are using a Garmin GPS download the DNR Garmin program (email me if you need help/more info on using these programs). If you have another program that downloads your GPS data to a txt, cvs, or spreadsheet you will need to import the file into ArcView and add the file as an event theme - for instructions on how to do this click HERE.
Above: GPS Data in UTM Coordinates downloaded to a text file
As mentioned earlier, most GPS units collect coordinates in Lat/Lon (degrees) or UTM (meters or feet). If you want to overlay your points onto an image that is in State Plane or other coordinate system you will need to re-project the shape file (theme) and then recalculate the X,Y coordinates so the attribute table displays the State Plane coordinates. To do this open the re-projected shapefiles attribute table (mydata_SP.dbf for example) and follow the directions below:
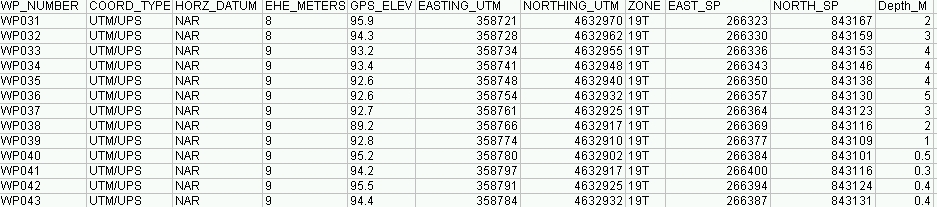
Above: GPS data (same as above image) that has been re-projected and fields
added to show State Plane (EAST_SP and NORTH_SP) coordinates and peat thickness (Depth_M) in
meters.
Creating Contour Maps:
Contour plots are made using regular or irregularly spaced XYZ data to create the map. The Z value can represent anything you are trying to model or grid such as elevations, depths to features, geophysical data, etc. There are many programs and procedures you can use to generate contour maps. There are numerous gridding methods used to create contour maps such as Natural Neighbor, Inverse Distance, Spline, and Universal Kriging. The gridding method used depends on the type of data and map you are trying to generate. I generally prefer to use the Kriging method to create the grid files. ArcView GIS does not (without using scripts) provide this method so I use SURFER to grid the data and create the contour plot. The SURFER plots are then exported to a shape file and added to ArcView so the Ortho image can be overlaid. The following explains this procedure:
Creating the GRID file with SURFER:
I like to view the GPS points in ArcView and modify the attribute table as explained above. Another good way to use ArcView is to create a (X, Y) boundary file of the area (a cranberry bed for example) which can be used in SURFER to blank areas outside the boundary. This saves having to walk the perimeter of the area to record the GPS boundary location. For more information on creating blanking/boundary files with SURFER send me an email (the SURFER manual explains the procedure well). Blanking areas outside of the survey area is very important if you will be calculating basin volumes.
The ArcView attribute database file now has the XY and Z coordinates needed to generate a contour map. Since SURFER (version 7.0) cannot open DBF files you will need to convert the attribute file into a Delimited Text file. To do this open the attribute table in ArcView and select "File - Export - Delimited Text". Name the text file and place it in the directory you are working in (I recommend creating a folder called "Surfer Files" to keep the SURFER data separate from the ArcView files).
Start a new plot in SURFER, select "Grid" then "Data" and navigate to the text file you exported from ArcView. A window will open called "Scattered Data Interpolation" under the "Data" tab fill out the XY and Z coordinates to grid, click the "General" tab and select the "Gridding Method" (use Kriging if unsure), name the file (*.GRD) and click OK. Once the gridding is complete go to the "Map" menu, select "Contour" and load the grid file. Customize the plot (contour interval, bases, smoothing, blanking, etc.) to meet you needs then export the file as an AutoCAD DXF file or an ArcView shapefile. Name the file and hit OK (for best results do not add any text to the SURFER file). Under the "Scaling Source" leave the "Application" box checked that will leave the State Plane coordinates in tact.
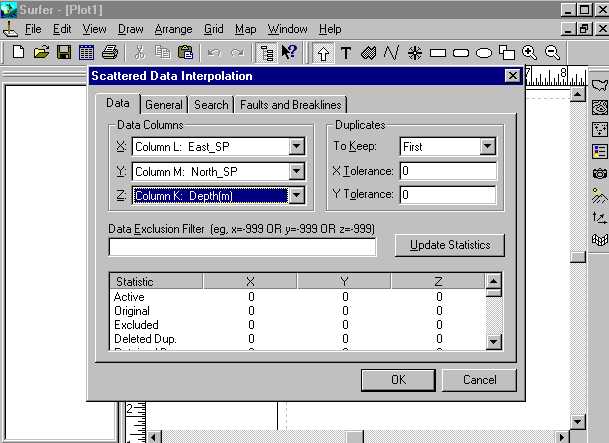
SURFER Grid Menu
Import the DXF or shape file into Arc/View:
Open Arc/View, and make the CAD Reader Extension active, select the "Add Theme" button and the DXF file should appear, open it and add it to the view. If you exported the file as a shape file just add it as a theme.
Wasn't that simple? After learning the procedure and doing it a few times it becomes real easy to go from the field, download the GPS data and have a nice map usually in under a half-hour. The hardest thing to learn are the various file types and conversions needed, you also end up with a lot of files when the map is complete so it’s a good idea to have a file naming convention set up so you don’t get confused.
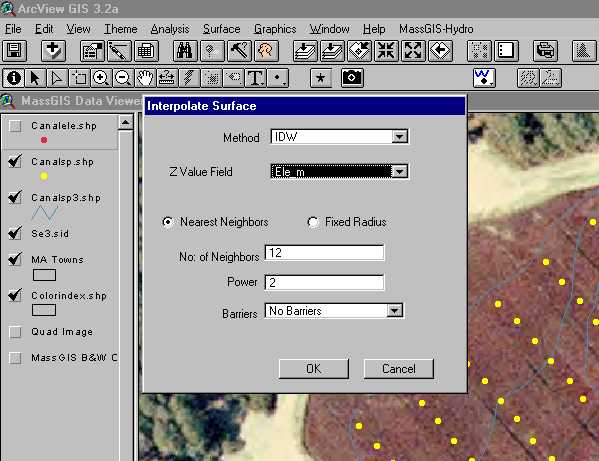
Using ArcView Spatial Analyst Extension to Create Contours:
To create contour maps just using ArcView GIS you need the Spatial Analyst extension (something you buy separately). If you have the SA extension loaded you will notice several new menu choices ("Analysis" and "Surface") in the view document window. To create a contour map add the point shape file with the X,Y,Z data, make the theme active and select "Surface - Create Contours" the Interpolate Surface dialog box will open, select the "Method and the field with the Z value" follow the other boxes which may open and the contour map should be generated.